Financial
 Top
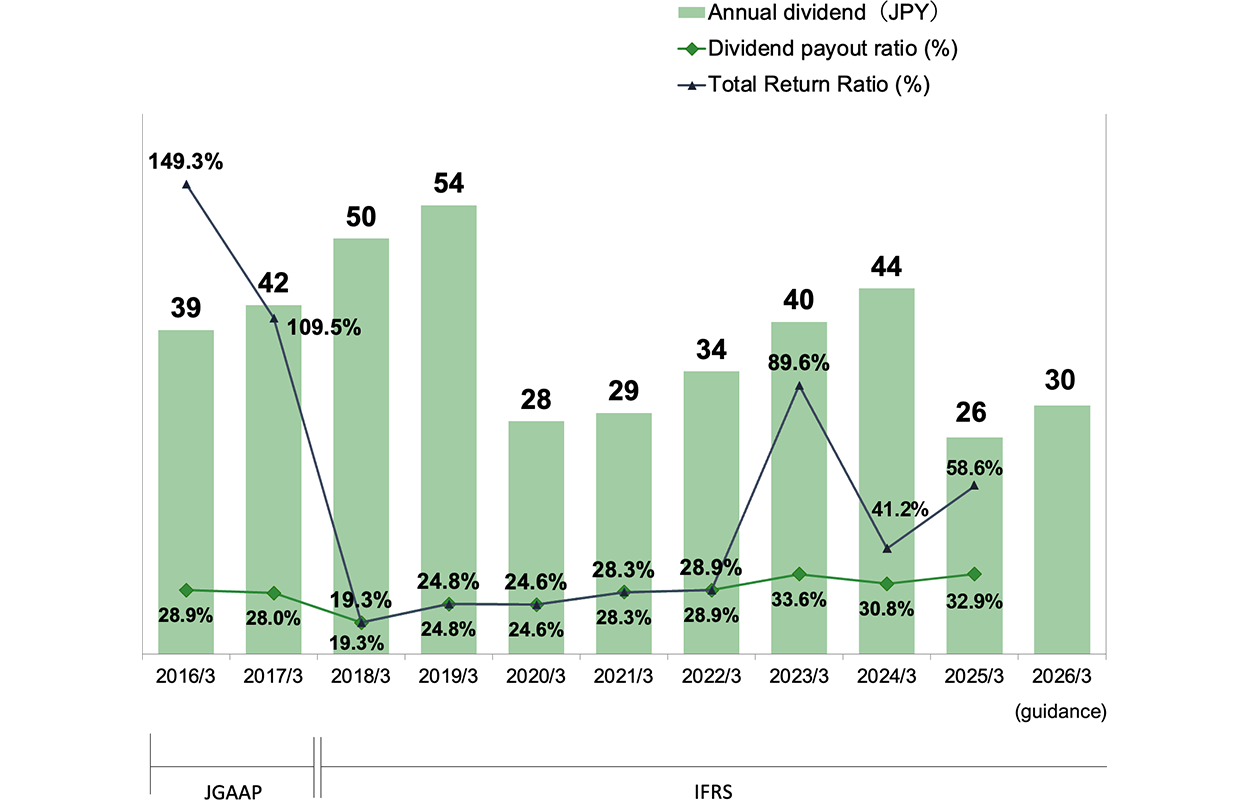
TopBasic policy for profit allocation
It is to stably increase dividends to shareholders in accordance with business performance, investment plan and other aspects. As for the distribution of profits to shareholders, Terumo has been aiming to steadily increase its dividend payouts to shareholders with the target dividend payout ratio of 30% in the mid to long-term.
In order to ensure a stable increase in its dividend payouts and to flexibly return profits to shareholders through acquisition of its own shares, Terumo has decided to aim for a total payout ratio of around 50% during the 5-Year Growth Strategy (GS26).
*
Terumo Corporation split each share of common stock into two shares effective on 1st April 2014, and cash dividends per share for the fiscal year ended March 2015 reflects this stock split.
*
Terumo Corporation has adopted IFRS from the fiscal year ended March 31, 2018.
*
Terumo Corporation split each share of common stock into two shares effective on 1st April 2019, and cash dividends per share for the fiscal year ended March 2020 reflects this stock split.
*
Terumo Corporation split each share of common stock into two shares effective on 1st April 2024, and cash dividends per share for the fiscal year ending March 2025 reflects this stock split.
Dividend Payment History
| Dividend (Unit: Yen / share) | Dividend payout ratio (%) | Accounting Standard | |||
|---|---|---|---|---|---|
| Interim dividend | Year-end dividend | Annual dividend | |||
| FYE 3/2013 | 22 | 22 | 44 | 17.8% | JGAAP |
| FYE 3/2014 | 29 | 29 | 58 | 32.3% | |
| Split each share of common stock into two shares effective on 1st April 2014 | |||||
| FYE 3/2015 | 14.5 | 16 | 30.5 | 30.1% | |
| FYE 3/2016 | 19 | 20 | 39 | 28.9% | |
| FYE 3/2017 | 20 | 22 | 42 | 28.0% | |
| FYE 3/2018 | 23 | 27 | 50 | 19.3% | IFRS |
| FYE 3/2019 | 27 | 27 | 54 | 24.8% | |
| Split each share of common stock into two shares effective on 1st April 2019 | |||||
| FYE 3/2020 | 14 | 14 | 28 | 24.6% | |
| FYE 3/2021 | 14 | 15 | 29 | 28.3% | |
| FYE 3/2022 | 16 | 18 | 34 | 28.9% | |
| FYE 3/2023 | 19 | 21 | 40 | 33.6% | |
| FYE 3/2024 | 22 | 22 | 44 | 30.8% | |
| Split each share of common stock into two shares effective on 1st April 2024 | |||||
| FYE 3/2025 | 13 | 13 | 26 | 32.9% | |
| FYE 3/2026 (guidance) | 15 | 15 | 30 | ||
Share Buyback History
| Acquisition period | Shares acquired | Total acquisition cost (thousand yen) |
|---|---|---|
| Dec. 14, 2001 - Jan. 23, 2002 | 2,800,000 | 4,567,728 |
| Jan. 25 - Feb. 20, 2002 | 2,200,000 | 3,254,260 |
| Jun. 28 - Jul. 17, 2002 | 1,300,000 | 2,084,490 |
| Jul. 19 - Aug. 21, 2002 | 1,200,000 | 1,973,021 |
| Sep. 20, 2002 | 1,250,000 | 2,215,000 |
| Feb. 21, 2003 | 1,250,000 | 2,311,250 |
| Jul. 18, 2003 | 860,000 | 1,701,940 |
| Oct. 30 - Dec. 4, 2003 | 1,000,000 | 1,991,824 |
| Dec. 19, 2003 - Jan. 21, 2004 | 599,700 | 1,187,435 |
| Mar. 19 - May. 20, 2004 | 51,400 | 118,817 |
| Nov. 28, 2006 | 4,230,000 | 19,965,600 |
| Aug. 21, 2007 | 2,500,000 | 12,600,000 |
| Mar. 10, 2008 | 2,350,000 | 12,690,000 |
| Oct. 31 - Nov. 14, 2008 | 4,000,000 | 17,861,923 |
| Feb. 4 - Mar. 24, 2015 | 915,600 | 2,999,879 |
| Aug. 12, 2015 | 3,089,800 | 10,999,688 |
| Feb. 5 - Mar. 24, 2016 | 12,767,900 | 49,999,805 |
| Feb. 10, 2017 | 11,000,000 | 44,220,000 |
| Jul. 1 - Dec. 8, 2022 | 11,838,500 | 49,999,908 |
| Aug. 14, 2023 – Mar. 8, 2024 | 2,333,900 | 11,097,087 |
| Sep. 17, 2024 – Dec. 30, 2024 | 10,137,600 | 29,999,988 |
Share Cancellation History
| Date of cancellation | Shares cancelled | Percentage of issued shares before the cancellation |
|---|---|---|
| Nov. 10, 2011 | 20,996,000 | 9.96% |
| Jan. 13, 2023 | 11,838,500 | 1.56% |
| Mar. 19, 2024 | 2,333,900 | 0.31% |
| Jan. 17, 2025 | 10,137,600 | 0.68% |